MB • LB • SB …
This most precious strip of shoreline — encompassing Monmouth Beach, Long Branch and Sea Bright — has been my home for 65 years. I’m in love with my native land, along with about 37,000 other residents (a tad more for summer). The three distinct shore towns are intertwined by a shared geography, history and outlook on life — I’m never leaving. It is on these superb beach towns and good neighbors where I will focus my research and writing effort. Here’s a brief snapshot of each:
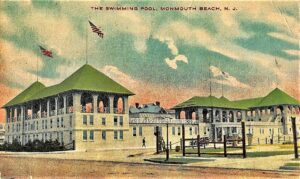
Monmouth Beach Images — HERE
Borough of Monmouth Beach, NJ 07750
Incorporated 1906 … 3,174 population … Mayor Timothy Somers (2029) … $10.5 Million ’25 Borough Budget … $144,500 Median Household Income … $1 Million Typical Home Value … 95% White … 68% College-Degree … 732-229-2204 … Website.
* * * * *
• Population History — Number of borough residents: 1910: 485 / 1920: 410 / 1930: 457 / 1940: 584 / 1950: 806 / 1960: 1,363 / 1970: 2,042 / 1980: 3,318 / 1990: 3,303 / 2010: 3,279 / 2020: 3,174.
• Budget History — Annual municipal expenditures (rounded figures): $11,100 in 1906 • $9,900 in 1909 • $21,200 in 1919 • $44,500 in 1922 • $97,500 in 1926 • $80,300 in 1932 • $151,800 in 1939 • $110,100 in 1947 • $137,500 in 1955 • $157,700 in 1958 • $222,300 in 1962 • $301,100 in 1965 • $366,000 in 1969 • $764,500 in 1974 • $1 million in 1977 • $1.5 million in 1983 • $2.4 million in 1989 • $3.8 million in 1996 • $4.7 million in 2002 • $6.1 million in 2007 • $6.9 million in 2012 • $7.4 million in 2017 • $9.9 million in 2023.
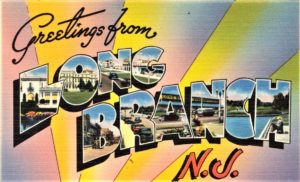
Long Branch Images — HERE
City of Long Branch, NJ 07740
Incorporated 1904 … 31,667 population … Mayor John Pallone (2030) … $80.3 Million ’25 City Budget … $62,000 Median Household Income … $643,574 Typical Home Value … 66% White/28% Hispanic/14% Black … 28% College-Degree … 732-222-7000 … Website.
* * * * *
• Population History — Number of city residents: 1880: 3,833 / 1890: 7,231 / 1900: 8,872 / 1910: 13,298 / 1920: 13,521 / 1930: 18,399 / 1940: 17,408 / 1950: 23,090 / 1960: 26,228 / 1970: 31,744 / 1980: 29,819 / 1990: 28,658 / 2000: 31,340 / 2010: 30,719 / 2020: 31,667.
• Budget History — Annual city expenditures (rounded figures): $59,400 in 1892 • $70,000 in 1896 • $75,200 in 1899 • $87,100 in 1902 • $104,400 in 1904 • $206,000 in 1907 • $282,000 in 1919 • $692,000 in 1926 • $1.2 million in 1930 • $816,100 in 1936 • $1.5 million in 1945 • $1.9 million in 1949 • $2.4 million in 1953 • $2.9 million in 1960 • $3.5 million in 1967 • $4.3 million in 1972 • $7.5 million in 1975 • $9.6 million in 1980 • $12.5 million in 1985 • $15.3 million in 1987 • $23.7 million in 1993 • $26.6 million in 1998 • $32 million in 2002 • $38.1 million in 2005 • $48.7 million in 2010 • $51.1 million in 2013 • $55.9 million in 2017 • $70.5 Million in 2024.
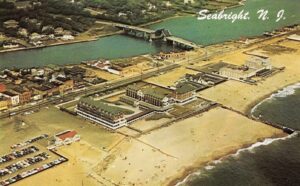
Sea Bright Images — HERE
Borough of Sea Bright, NJ 07760
Incorporated 1896 … 1,449 population … Mayor Brain Kelly (2028) … $8 Million ’25 Borough Budget … $91,600 Median Household Income … $820,740 Typical Home Value … 95% White/2% Black … 66% College-Degree … 732-842-0099 … Website.
* * * * *
• Population History — Number of borough residents: 1900: 1,198 / 1910: 1,210 / 1920: 856 / 1930: 899 / 1940: 779 / 1950: 999 / 1960: 1,138 / 1970: 1,399 / 1980: 1,812 / 1990: 1,693 / 2000: 1,818 / 2010: 1,412 / 2020: 1,449.
• Budget History — Annual municipal expenditures (rounded figures): $11,500 in 1906 • $13,700 in 1920 • $30,500 in 1925 • $42,500 in 1930 • $40,200 in 1935 • $53,700 in 1942 • $106,000 in 1945 • $172,700 in 1949 • $201,200 in 1954 • $241,500 in 1960 • $327,500 in 1965 • $366,700 in 1968 • $852,000 in 1975 • $1.1 million in 1980 • $1.4 million in 1985 • $2.4 million in 1990 • $2.9 million in 1995 • $3.9 million in 2000 • $4.8 million in 2008 • $5.2 million in 2011 • $5.9 million in 2017 • $7.9 million in 2024.
Sources: US Census Bureau; Long Branch Daily Record, Asbury Park Press, and Red Bank Daily Register digital archives.
The Price of Life …
• $1 Million — Monmouth Beach average home value
• $933,839 — Sea Bright average home value
• $745,864 — Long Branch average home value
• $709,482 — Monmouth County average home value
(Zillow.com, 2025)
* * * * *